This Week in Abortion: Elections & An Introduction to Systems Thinking
A collection of good reads, events from the week, and policy insights.
Welcome back to your weekly roundup of good reads, news updates, and policy insights on abortion.
This week we have a quick breakdown of this Tuesday’s most important elections and a guest feature by Sharita R. Thomas. Thomas is a Ph.D. candidate in health policy and management at UNC, focusing on health inequity. She is also working on her Birth and Postpartum Doula Certification. This is a two-part feature, kicking off with a layperson’s intro to the practice of systems thinking.
Good Reads
I recently joked with a friend that being around her always seems to trigger my period. So, imagine my embarrassment when Dr. Jen Gunter immediately schooled me on the dangers of perpetuating the sexist myth of menstrual synchronization. (8 min read)
Infant deaths in 2022 were 3% higher than in 2021, which is the first increase in 20 years. A report by the National Center for Health Statistics showed that infants born to American Indian, Alaska Native, and White women died at significantly higher rates, as did infants born to women between the ages of 25 and 29. Although 2022 was the year of Dobbs v. Jackson, it’s not yet clear if or how the Supreme Court decision impacted these trends. More likely they are both part of the bigger story that Sharita Thomas is studying and is talking about below. (2 min read)
If/When/How released a report detailing cases of criminalizing self-managed abortion from 2000 to 2020. It’s a long but good read. One of the biggest takeaways was that women should be careful of their digital footprint - police aren’t watching you, but they will use your digital history after the fact. Also, while laws specifically banning self-managed abortion are scary and bad news, women were usually charged under different, unrelated laws, which speaks to the complicated fight that existed before Dobbs v Jackson and that still lies ahead. (1h 35min read)
Elections to Watch
Ohio: In an election normally reserved for the most local of local offices, Ohio voters will decide next week on the fate of abortion access and whether to legalize cannabis in their state. Signs from early voting numbers and fundraising are positive.
Virginia: With access to abortion still available up to about 27 weeks, Virginia is an important destination for abortion care. It’s more important than ever for the state to maintain access now that neighboring North Carolina has a 10-12 week ban in place.
States News Room has a clear write-up of the dynamics in the Virginia state legislature race. Democrats are running on preserving abortion access and Republicans are running on the economy while testing out messaging to see if voters will accept a 12- to 15-week ban as a “reasonable compromise.” Check out the ad they are running below.
But, before you go thinking it’s all about abortion: coal and counter-coal interests were some of the biggest political donors this year. For an off-year election, there will be plenty to dissect next week.
Kentucky and Pennsylvania: Unlike in VA and OH, these races will not have any immediate effect on abortion access. However, the races for governor in Kentucky and Supreme Court in Pennsylvania are still being watched closely for 2024 smoke signals, and because these positions may be critical for growing and protecting access in these states in future years.
Top Abortion Updates
👎 A judge in North Carolina snuck an argument that “life begins at conception” into his ruling taking away a mother’s custody of her child.
👍A Missouri appeals court unanimously found that the ballot titles Secretary of State Jay Ashcroft wrote for pro-access initiatives were “replete with politically partisan language.” The court also rejected another anti-access challenge, so this week delivered some wins for MO pro-access groups. But, at least one of these cases is likely heading to the state Supreme Court – a distraction bid in the leadup to the election. Bad faith court arguments are a great delay tactic in politics. Let’s hope Missouri voters are tired of it.
👍 A Kansas judge blocked a number of egregious laws covering abortion clinics, including one recent requirement for clinics to give patients medically incorrect information.
👍 Tuberville’s gonna Tuberville, but at least more of his fellow Republicans are challenging him.
Zooming Out: An Introduction to Systems Thinking on Abortion
Sharita R. Thomas is a Ph.D. candidate in health policy and management at UNC, focusing on health inequity. Thomas represented UNC at Map the System 2022, a Systems Thinking global competition, held annually at the Skoll Centre for Social Entrepreneurship at Oxford University. She is also working on her Birth and Postpartum Doula Certification. This is a two-part feature, kicking off with a layperson’s intro to the practice of systems thinking.
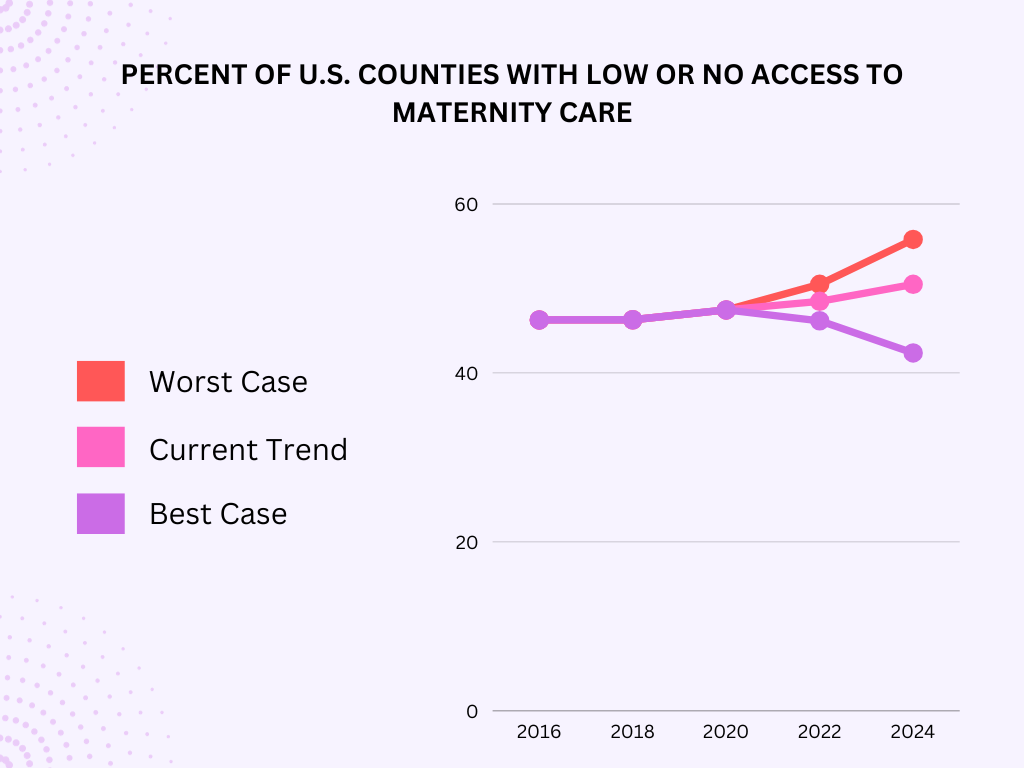
Over 35% of US counties have little to no access to obstetric and maternity care services, an increasing trend since 2016. Access to healthcare services is and has been a growing concern, thanks to provider shortages, household healthcare costs, and many other factors like abortion bans. And since the Supreme Court revoked the constitutional right to abortion in 2022, access to maternal care services is expected to worsen.
Large and complex issues such as these often leave us feeling frustrated and helpless to act. But Systems Thinking, used in a variety of fields from business to academia, provides us with tools to simplify systems and identify effective solutions. In the first part of this feature, I’m going to walk through the foundation of Systems Thinking using as an example the issue of access to obstetric services in the United States. In the upcoming second part, I’ll expand on Systems Thinking methods useful for tackling the issue of access to abortion services.
The core power of Systems Thinking is the visual mapping of relationships. These maps help us to step back and see how complicated relationships interact on a large scale. Through Systems Thinking, we can see both the forest and trees at the same time.
Let’s begin with two common tools used in Systems Thinking: Behaviors Over Time and Causal Loops Diagrams.
Behaviors Over Time
The Behaviors Over Time tool is a simple line graph of how something increases or decreases over time. This type of visualization gives us a clearer insight into interesting patterns.
In the story of access to obstetric services in the US, hospitals play an important role. For various reasons including scope of practice and insurance payer benefits, approximately 98% of US births occur in a hospital setting. Therefore, the percentage of hospital facilities with labor and delivery services available is a good variable capable of showing changes in access over time.
As you can see in the Behavior Over Time chart above, availability of obstetric services has been declining since at least 2010. The data in this graph represents real trend data for 2016 to 2020 from March of Dimes. The forecasted trajectory from 2022 to 2024 considers the trend of what we know (past and current data/anecdotes) and simulates likely trajectories for the future. Determining future trend lines is not a perfect science. Projections can be based on modest "guesstimates," real forecasted data, or hypothesized scenarios. In this case, I quickly pulled data points for the same variables from a biennial report by the March of Dimes.
Causal Loops Diagrams
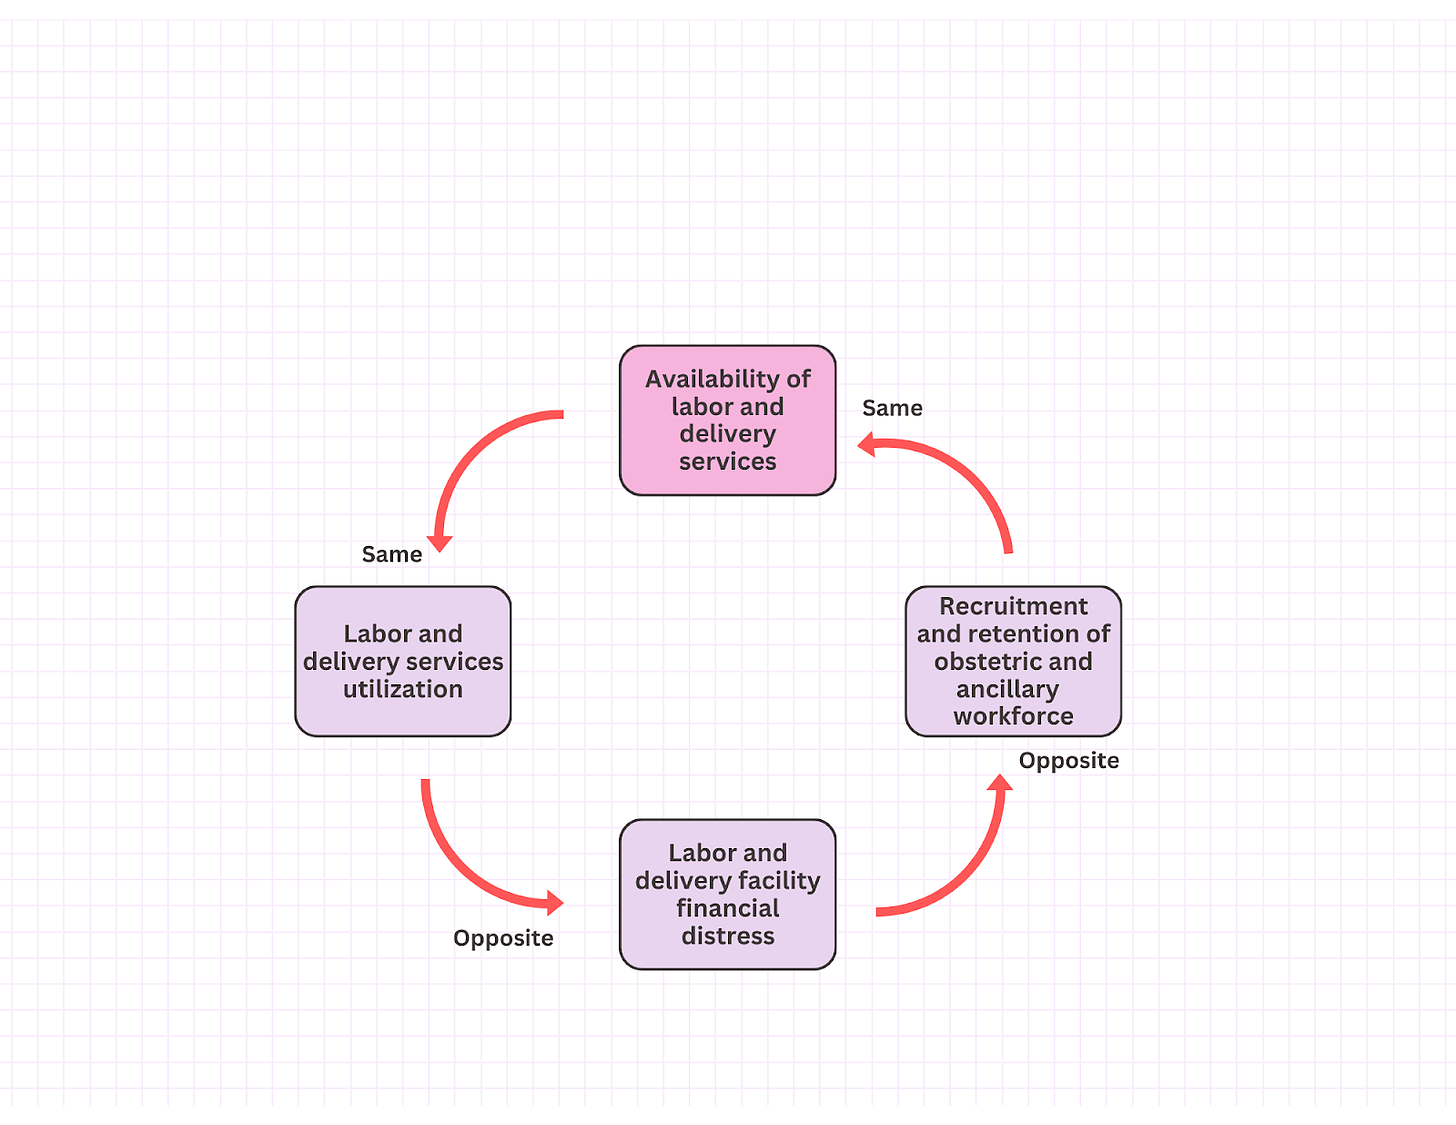
Causal loops diagrams (CLDs) are maps of causal paths, or “if/then” relationships. While many factors impact complex trends, CLDs aim for clarity.
To build a CLD, you first identify the factors relevant to the story. In our simple case, we have availability of labor and delivery services and recruitment of obstetric and ancillary workforce. You then identify the relationships and the direction of interaction between the factors that best tell the story. Here, the interaction is the same: as recruitment goes up, service availability goes up. The process of identifying relationships and interactions grows in difficulty as you work through each factor.
The availability of labor and delivery services is the centering factor in our story. In the progression of diagrams below, I’ll show you how workforce volume, hospital financial health, and many other factors relate to service availability and contribute to trends in availability.
Tracing the paths between each of these factors using “if/then” statements helps to determine the directions of the relationships, revealing individual loops and additional factors that contribute to the loop. The strength of causal loop diagramming is that it helps us to reveal relationships between elements that we may not have initially considered.
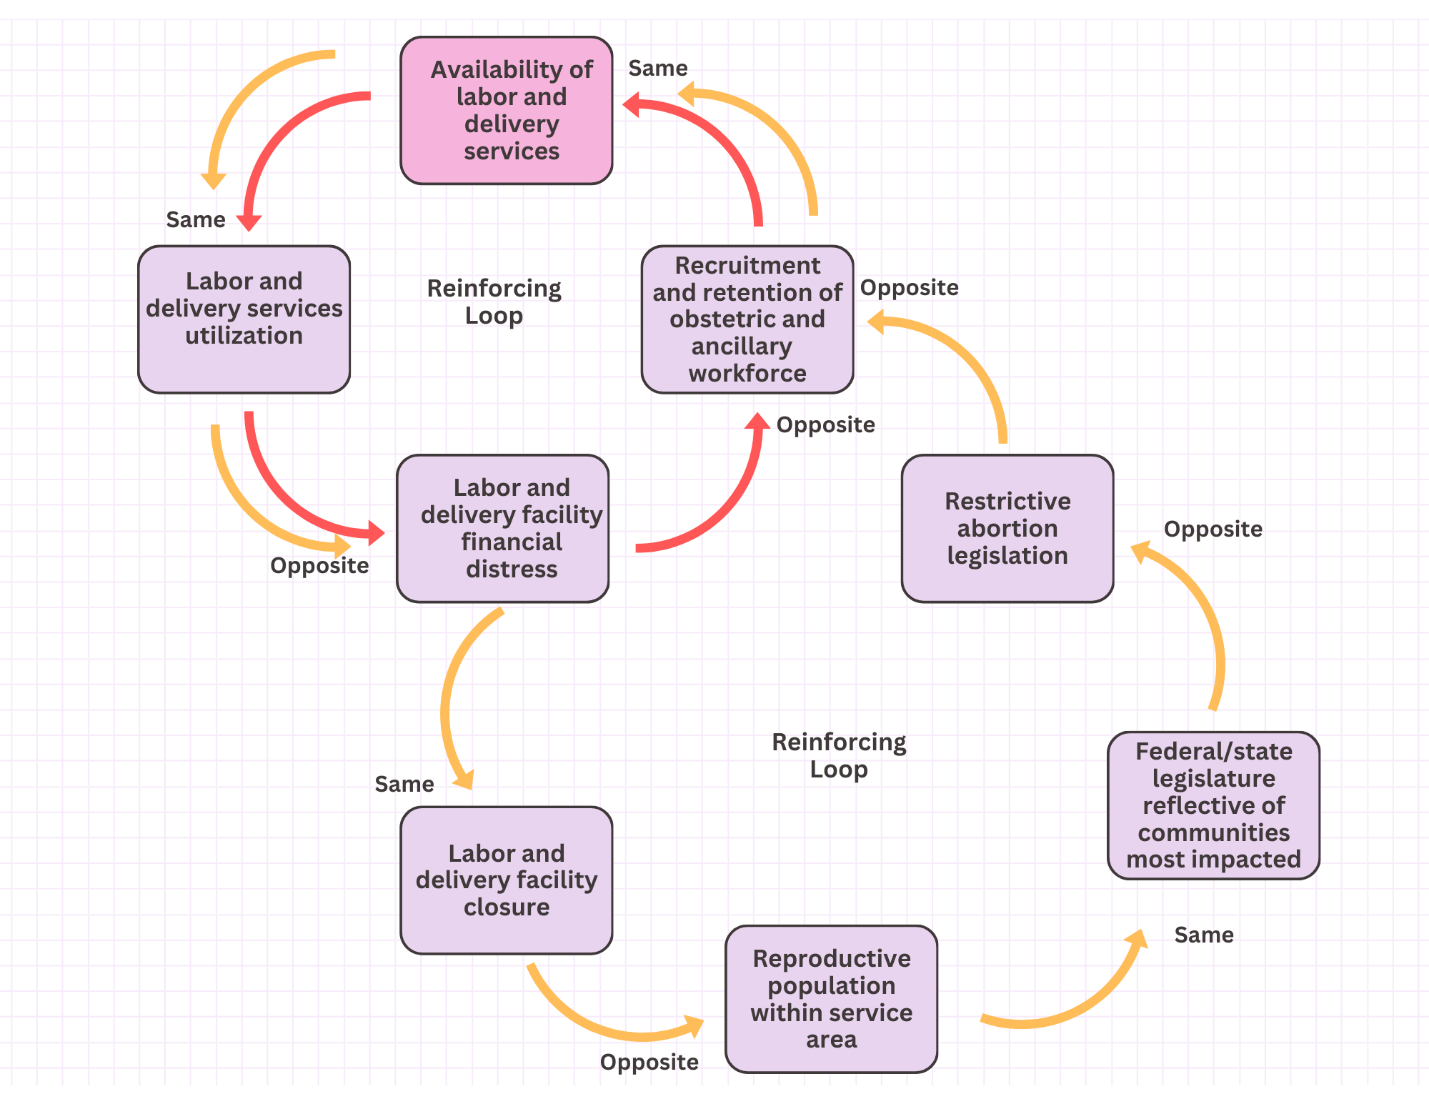
In Figure 3 below, I’ve added an additional loop in yellow, which adds another chapter to the story of service availability. This yellow loop is called a reinforcing loop because it amplifies the changes in our original loop (i.e. results in an ever-increasing rate of growth).
If financial stress on facilities goes up, then more facilities will close.
Over the long term, this may contribute to a reputation that the area is not conducive to starting a family. If that happens, then fewer people of reproductive age will settle there.
If the portion of constituents interested in reproductive health services declines, then the chances of someone from this category getting elected into a public service office declines.
If elected officials don’t reflect the reproductive population, then it becomes more likely that restrictions on abortion services will be proposed and possibly passed.
If those restrictions pass, then as we are seeing today, it becomes more difficult to recruit a good workforce. This brings us back to the story of our first causal loop, in red.
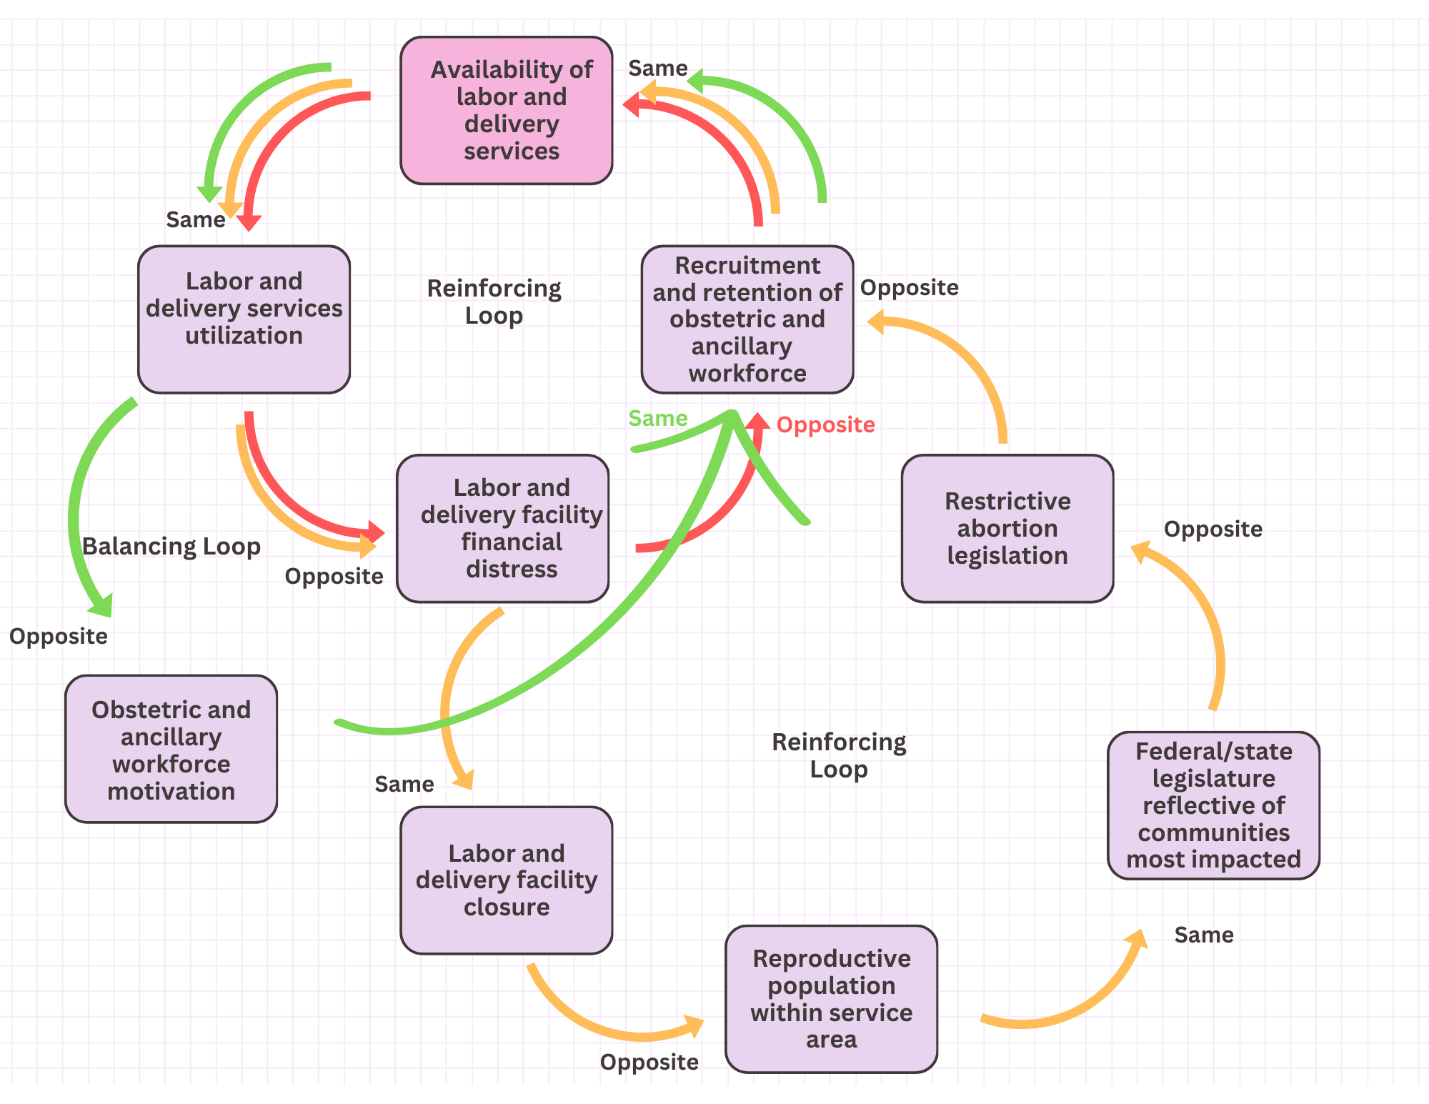
CLDs can grow to contain enough loops necessary to comprehensively tell the story. Factors related to each of the factors in our initial loop can compose their own new or intersecting loops. New factors can even balance out some trends. For example, in Figure 4, I’ve added the factor of workforce motivation
As you can imagine, these diagrams can get pretty large. Systems thinkers utilize CLDs to identify possible leverage points for action, as well as the resources and actors available to carry out potential actions. Levers for action can range from low-level or operational, like increasing the number of maternity care providers, to high-level, like a cultural shift in how we view maternity care.
Our example has a negative reinforcing loop (yellow) where the policymakers at various levels of government are not reflective of the populations most impacted by restrictive abortion legislation. Flipping this, we can hypothesize that if we find a way to change the composition of the legislature, over time that would result in fewer restrictions, facilitating recruitment of doctors and leading to more utilization of all obstetric services. This is an example of a leverage point that could break negative reinforcing loops and change the flow into a positive one.
Applying the Thinking
So what comes next once we’ve used our systems thinking tools to identify patterns and relationships? How can we apply systems thinking to the issue of access to abortion services?
In the past, traditional approaches have worked well enough to establish a case for access to abortion services. For example, groups of doctors and advocates may have made a public call or recommendation for an action. Yet today, the increasing complexity of systems intersecting the issue of abortion requires a paradigm shift when considering paths forward.
But paradigm shifts come in phases, and before power structures and rules evolve, we will need lower-level interventions that target specific leverage points within the current systems. I’ll say more about what I think those levers are in my next feature. Till then, I encourage you to consider what relationships you see in your own life or professional field that intersect with changing trends in abortion access. The following links will take you to a few beginner-friendly resources for Systems Thinking:


